According to CNT 2012, which
conducted a survey in approximately 45% of the paved network, evaluating the
pavement functional conditions, traffic signs and geometry, 46% of the
country’s road network has some types of deficiency in the pavement. The goal
of this work is to contribute to a better understanding of the complex
influence of traffic in the design and service life of the pavement. The load
pressure of commercial vehicle tires over the pavement has increased in recent
decades. A more apparent effect of this increase in tire pressure would be the
change in the pavement- tire contact area which in turn may result in an
increase in the contact load between tire and pavement and other harmful
effects on the structure. This study aims to determine the effect on the
calculation of the N number, or the number of solicitations of the standard
axle on the road pavement, measuring the overload as a percentage of the legal
load indicated by a scale. Thus, we calculate how an increase in the overload
percentage in comparison with the allowable load will influence the decrease of
the calculated durability of the pavement designed for the highway.
Keywords:
road; tire; load; damage.
1. INTRODUCTION
Roads
are the country’s primary means of cargo transportation. Over the 1990s and
2000s this modal accounted for over 60% of the total cargo transported in the
country (IPEA, 2010). Excluding the transportation of iron ore that is made by
railway, roads account for more than 70% of general cargo.
In 1950, roads
were responsible for 38% of the national cargo transportation (BNDES, 2008).
When Juscelino Kubitscheck’s government defined the Target Plan, roads were
prioritized in order to, among other goals, stimulate the manufacturing
industry through the auto industry. Since then the Brazilian transport matrix
has shown this unbalance, with investments almost exclusively in this type of
modal.
The significant
dependence of this modal for the Brazilian cargo transportation is emphasized
when compared to other countries with similar dimensions. According to
Bartholomeu (2006), in the United States, roads account for 26% of cargo
transportation, while in Australia this figure is 24% and in China only 8%.
According to the
National Confederation of Transport (CNT, 2012), the Brazilian road network
consists of 1,366,578 km of unpaved roads and 214,414 km of paved roads, which
represents one of the world’s biggest road networks. Despite its large
extension, only about 13% of the network is paved.
According to a
survey conducted by CNT (2012) in approximately 45% of the paved network,
evaluating functional pavement conditions, traffic signs and geometry, 46% of
the country’s road network show some kinds of pavement deficiency.
IPEA (2010)
conducted a study to identify bottlenecks and deficiencies of national roads
and they concluded it would take 183.5 billion reais in investments to solve
the problems and boost the road sector, increasing its efficiency and its
impact on the country’s economy.
Within this context,
it is clear that the country’s economy depends on this modal and that Brazilian
roads are in poor conditions. Road pavement stands out mainly because it
represents the highest costs, either of deployment, restoration and
maintenance, as well as providing users a proper traffic-ability with comfort
and safety, resisting the actions of traffic and distributing the efforts to
its underlying layers so that the entire set leads to savings in fuel costs,
risk of accidents, cargo damages, among others.
One of the main
factors to determine the pavement’s service life is the type and volume of the
traffic to which it will be exposed over its lifetime and its project.
Therefore, studies are needed to contribute to a better understanding of the
complex influence of the traffic on the pavements sizing and service life
(MEDINA; MOTTA, 2005).
In order to
standardize the measurement of the factors that influence the pavement sizing,
combining the current traffic, the projected traffic and the consequences of
its use, mainly through commercial loads, on the fatigue of the pavement
structure, computer programs were created that verify the project’s viability
and durability. Among the standards established and accepted by the projects of
the National Department of Transport Infrastructure (DNIT) and its state
representatives according to the Paving Manual – IPR – 719 (2006) or the
IP-DE-P00/001 – Paving Projects of DER/SP, the following parameters were
defined: the standard single axle dual wheel of 80 kN and the tire-pavement
contact pressure of 0.56 MPa.
Considering the
variation of ambient temperature, the differences of transported loads that
generate more or less friction between the tires and the pavement. The absence
of automatic pressure calibration equipment in the vehicle, the driver’s
negligence regarding the equipment calibration and the load allowed by law, as
well as the quality of tires, leaks, etc., we can relate the variation of tire
pressure on the pavement with the resulting different structure fatigue through
a study where loads are altered in the mechanistic analysis program and the
structure behavior is verified.
Therefore, the
general goal of this work is to analyze the structural condition of a standard
pavement used in projects of Brazilian roads with predefined and constant
dimensions, changing the tire pressure applied to the pavement used in standard
methodology and verifying the effect on the pavement layers through fatigue
equations standardized by DNIT.
2. LITERATURE REVIEW
According
to National Federation of Automotive Vehicles Distribution (FENABRAVE), the
commercial vehicle industry starts growing from the year 2000, associated to
the growth of the Brazilian economy and the increase in the transport of
commodities. Given the high average age of the Brazilian fleet (Trucks: 17.2
years and Buses: 14.4 years), loan portfolios were created to finance and
stimulate the commercial vehicle market. Table 1 shows the production by size
from 2008 to 2014.
Table 1: Production by size (units)
|
|
2008
|
2009
|
2010
|
2011
|
2012
|
2013
|
2014*
|
|
Semi-Light
Trucks
|
6,908
|
4,961
|
7,216
|
8,451
|
2,450
|
4,059
|
2,225
|
|
Light Trucks
|
29,330
|
31,493
|
41,740
|
50,686
|
24,497
|
32,093
|
27,875
|
|
Medium Trucks
|
15,553
|
12,968
|
17,690
|
18,358
|
8,448
|
12,340
|
8,291
|
|
Semi-Heavy
Trucks
|
53,292
|
40,024
|
62,813
|
76,977
|
50,671
|
70,917
|
50,474
|
|
Heavy Trucks
|
58,674
|
31,548
|
60,482
|
68,916
|
46,887
|
67,680
|
51,100
|
|
Total
|
163,757
|
120,994
|
189,941
|
223,388
|
132,953
|
187,089
|
139,965
|
Source: CNT (2012)
2.1.
Pavement and traffic
According to Huang (1993), traffic is the main factor
when designing a pavement structure. The traffic variable should include load
magnitude, the configuration and the number of load repetitions. According to
Yoder and Witczak (1975), the main factors to evaluate the structure of a
pavement design are the effects of the type of vehicle, traffic volume and the
type of vehicle. The type of vehicle should include specific factors such as
axle configuration, wheelbase, wheel load and tire inflation pressure.
According to DNIT (2006), trucks are the largest
consumers of the pavement structure because they apply the highest loads on its
surface. Among the heavy trucks, not all cause the same damage due to the
variations in wheel load (static and dynamic), the number and location of
axles, the types of suspension, the number of wheels, the type and pressure of
tires and other factors. Balbo (2007) adds that road commercial vehicles
(trucks and buses) are the ones that actually
matter for designing the pavement since light vehicles cause minor
damages to the pavement structure when compared to the load of commercial
vehicles.
The pavement is a structure of multiple layers of
finite thicknesses, implemented over a final surface of earthwork or sub base,
technically and economically intended to resist the efforts resulting from
vehicle traffic and weather. It is designed and built to resist the volume of
motor vehicles under different climate conditions and to improve the rolling
conditions in terms of comfort and safety (SENÇO, 1997; BERNUCCI, et al.,
2006).
Road traffic is quite diverse in terms of types of
vehicles and cargo transported. One of the difficulties to design the pavement
is to foresee the evolution of traffic over time and the evaluation of the
destructive power, comparatively, of the various loads and different levels of
repetition (MEDINA; MOTTA, 2005).
One of the first surveys to collect data about
commercial fleet weighing was conducted by Executive Integration of Transport
Policies Group (GEIPOT) between 1976 and 1981 and indicated that on Brazilian roads
trucks travel with an overload of 10 to 30% beyond the limits (FERNANDES JR.,
1994).
According to Pinto and Preussler (2002), the
variations of axle overload and the corresponding destructive effects on the
pavements take place exponentially. They point out the importance of avoiding
using overloaded vehicles. Regarding the use of the tire, the pavement design
guide considers the tire inflation pressure of 750 kPa, however it adds that
data from Tasmania indicate that the tire inflation pressure can vary from 500
to 1200 kPa (AL‐QADI;
ELSEIFI, 2007).
Kawa et al. (1997) conducted a survey for the Texas
Department of Transportation evaluating the concept of load equivalency used by
the AASHTO (1972 and 1983). The work points out that determining the load
equivalency factors (LEFs) is essential to prepare new pavement projects and
existing pavement rehabilitation. The incorrect evaluation of the damage caused
by axle load on pavements can result in early failure and raise costs. On the
other hand, an overestimate can result in unnecessary expenses, taking funds
from other projects.
The following factors should be analyzed to determine
if they have any effect over the LEFs: i) increase of tire pressure; ii) new
suspension systems; iii) new tire widths such as wide base; iv) new axle
configurations, such as tandems and dual tandems; v) environmental factors.
In the road test of The American Association of State
Highway Officials-AASHO, the tire inflation pressure varied from 520 to 550 kPa
(75-80 psi). Today trucks usually use tires with pressure ranging from 600 to
800 kPa (85 to 115 psi) and, in some cases the tire pressure can reach 900 to
1000 kPa (130 to 145 psi). Literature review shows that high tire pressures can
potentially cause more damages to the pavements.
According to Feng (2005) the tire pressure of
commercial vehicles has increased in recent decades. A more visible effect of
increasing tire pressure would be the reduction of the tire/pavement contact
area, which in turn can result in an increase of the tire/pavement contact and another
damaging effect on the structure.
2.2.
Types of Brazilian road traffic and their characteristics
The
Brazilian legislation establishes some parameters for the circulation of
commercial vehicles on roads, including: Law 9.503/97 Brazilian Traffic Code
(BRAZIL, 2015); CONTRAN Resolution 210/06; CONTRAN Resolution 211/06; DENATRAN
Decree 63/2009; Lei 7.408/85; CONTRAN Resolution 258/07 and CONTRAN Resolution
365/10.
Within the scope of the present research, the
Brazilian Traffic Code establishes the following provisions:
•
In order to travel on roads the vehicle
must comply with the limits defined by CONTRAN regarding weight and dimensions,
and the overweight should be measured by weighing equipment or by checking tax
documents. Additionally, a percentage over the limits of the total gross weight
and the gross weight transmitted by vehicle axle to the road surface is
tolerated.
•
Passenger or cargo vehicles will not
travel with capacity or load above the limit defined by the manufacturer, and
neither exceed the maximum traction capacity of the traction unit.
•
Driving the vehicle with overweight,
considering the tolerance percentage when measured by a weighing equipment,
will result in a moderately serious offense with a fine increased every two hundred
kilograms or a fraction of verified overweight, according to the law.
The Resolution No 210 of November 13,
2006, “defines the weight and dimension limits for vehicles travelling on roads
and offers other provisions”. According to DNIT (2015), the resolution establishes
the maximum limits of Total Gross Weight and Total Gross Weight Combined (Table
2).
Table 2: Maximum Weights: Resolution nº
12/98, Article 2
|
Axle
|
Rolling
|
Suspension
|
Wheelbase (m)
|
Load (kg)
|
Tolerance (7.5%)
|
|
Single
|
Single
|
Directional
|
-
|
6,000(¹)
|
6,450
|
|
Single
|
Single
|
Directional
|
-
|
6,000(²)
|
6,450
|
|
Single
|
Double
|
-
|
-
|
10,000
|
10,750
|
|
Double
|
Single
|
Directional
|
-
|
12,000
|
12,900
|
|
Double
|
Double
|
Tandem
|
>1.20 or <2.40
|
17,000
|
18,280
|
|
Double
|
Double
|
Not tandem
|
>1.20 or <2.40
|
15,000
|
16,130
|
|
Double
|
Single + Double
|
Especial
|
< 1.20
|
9,000
|
9,680
|
|
Double
|
Single + Double
|
Especial
|
>1.20 or <2.40
|
13,500
|
14,520
|
|
Double
|
Extra-wide(4)
|
Pneumatic
|
>1.20 or <2.40
|
17,000
|
18,280
|
|
Triple(³)
|
Double
|
Tandem
|
>1.20 or <2.40
|
25,500
|
27,420
|
|
Triple(³)
|
Extra-wide(4)
|
Pneumatic
|
>1.20 or <2.40
|
25,500
|
27,420
|
(¹) For wheels with a diameter
less than or equal to 830 mm; (²) Observed the capacity
and weight limits indicated by the tire manufacturer and diameter greater than
830 mm; (³) Applicable only to semi-trailers; (4)
Single tire (385/65 R 22,5) applicable only to semi-trailers and trailers
according to CONTRAN Resolution n° 62 of 5/22/98. Source: DNIT (2015)
The Resolution No 211 of November 13,
2006, defines the necessary requirements for the circulation of Combinations of
Cargo Vehicles (CCV) mentioned in Art. 97, 99 and 314 of the Brazilian Traffic
Code, establishing, within the context of this research that the combinations
with more than two units, including the traction unit, with total gross weight
over 57 tons or total length over 19.80 meters, will only be able to circulate
with a Special Traffic Authorization (STA).
The Article II of the Resolution defines
the minimum requirements for a special traffic authorization, which will not be
the object of this research because it represents an insignificant share in
terms of road traffic.
Regarding the load configuration, the
DENATRAN Decree no 63 of March 31, 2009, homologous the vehicles and
combinations of cargo and passenger vehicles specifying the limits of length,
total gross weight (PBT) and total combined gross weight (PBTC). After, the
DENATRAN Decree no 63 was issued and it was possible to observe the types of
load vehicles and the combinations with their respective weight limits.
The Law 7.408 of November 25, 1985 establishes
the tolerance of 5% when weighing the load of transport vehicles. According to
DNIT (2015) the tolerance aims to address the uncertainty of the measurement
equipment. The CONTRAN Resolution nº 258/07 “regulates the articles 231, X and
323 of the Brazilian Traffic Code, establishes the methodology of measuring the
vehicles’ weight, defines tolerance percentages and makes other provisions”.
The Resolution nº 258/07 brings back the
fine by axle, which had been suspended by the Resolution nº 104/99. Up to 31
January, 2008 the Resolution nº 258/07 accepted a tolerance of 7.5% (seven and
a half percent) by axle. After that, the tolerance by axle will be of 5% (five
percent).
The Resolution nº 258/07 also establishes,
regardless of the type of load, limits by axle that allow the vehicle’s travel
to continue without the need of relocation or overflow after an overweight fine
is applied. The Resolution establishes that the tolerance is valid for the
equipment (“scale”) and cannot be incorporated during the loading. Whoever uses
the tolerance during loading would be illegally increasing its limits, thus
reducing the tolerance intended for scale faults and considerably increasing
the risk of getting a fine. Additionally, the 5% (five percent) tolerance was
abolished during invoice checking; this tolerance was previously defined by the
now revoked Resolution nº 104/99, which only allowed verification through the
invoice on roads where there were no scales. Now, when there is no scale, the
measurement can be made at any time or place through the weight declared in the
invoice, waybill or cargo manifest, and no tolerance is allowed regarding the
declared weight.
Besides the changes mentioned above, the
Resolution nº 258/07 established a fine to vehicles that travel with a load
above the Maximum Traction Capacity (MTC) defined by the manufacturer. Finally,
it clearly defines the shipper as the load sender or dispatcher, even if it is
freight collect.
According to CONTRAN Resolution nº 365/10
the deadline of December 31, 2011 defined by article 17 of the CONTRAN
Resolution nº 258/07 was extended. Therefore, the maximum tolerance of 7.5 %
(seven and a half percent) over the limits of gross weight transferred by the
axles to road surfaces will still be allowed. After that date, the maximum
tolerance will again be 5% (five percent).
2.3.
Weighing of commercial vehicles
According
to DNIT (2006) the weighing operation consists of weight checking by axle or
set of axles and of the total gross weight, performed at the weighing sites
using mobile or fixed scales located in an area of the road that doesn’t
disturb the flow of vehicles. Also, according to DNIT, the weighing shall
follow these guidelines:
•
Weighing platform: place at the weighing sites where
the scales are installed;
•
Selective scale: equipment intended to select vehicles
with a probable overweight, directing them to the low-speed static or dynamic
weighing;
•
Static mobile scales: consists basically of two (2)
plates over which the axles are statically weighted;
•
Dynamic mobile scales: consists basically of two (2)
plates over which the vehicle’s axles are weighted at a speed of up to 10km/h;
•
Static fixed scales: consists basically of one (1)
plate over which the vehicle stops with all its axles and it is weighted
statically;
•
Dynamic fixed scales: consists basically of one (1)
plate over which the vehicle is weighted at a speed of up to 10Km/h;
•
Transit authority agent: civil or military individual
who is certified by the traffic authority to perform the supervision,
operation, overt traffic policing and patrolling activities;
•
Weighing infraction notice: document issued at
weighing operations, indicating that the total gross weight or the total gross
combined weight, according to the model, exceeded the limits;
•
Infraction notice of Maximum Traction Capacity (MTC):
document issued at weighing operations, indicating that the Maximum Traction
Capacity was exceeded;
•
Total Gross Weight (TGW): maximum weight that the
vehicle transmits to the pavement, consisting of the tare plus the capacity;
•
Total Gross Combined Weight (TGCW): maximum weight
transmitted to the pavement by the combination of a tractor-truck and its
semi-trailer or a truck and its trailer or trailers;
•
Maximum Traction Capacity (MTC): maximum weight that
the traction unit is capable of driving, indicated by the manufacturer, based
on its limitations to generate and multiply the momentum and the resistance of
the elements that are parts of the transmission system;
•
Capacity: maximum payload, including the driver and
passengers that the vehicle carries, expressed in kilograms for cargo vehicles
or the number of people for passenger vehicles;
•
Tare: vehicle’s own weight plus the weight of the body
and equipment, fuel, tools and accessories, spare wheel, the fire extinguisher
and the cooling fluid, expressed in kilograms;
•
Combination of cargo vehicle (CCV): combination of
more than two units, including the traction unit, and/or a length range between
18.15 and 30.00 meters, and/or a total gross combined weight between 45.0 and
74.0 tons.
2.4.
Tires
The
inflation pressure range recommended by Pirelli, between 750 and 800 kPa, is
the most significant within the universe of commercialized tires. In order for
an actual verification it would be necessary to know the sales percentage of
each type of tire and to check, using other tools, the actual inflation
pressure. However, this gives us a comprehensive parameter of the actual
inflation pressure acting on the pavement.
To better visualize the inflation pressures
recommended by Pirelli a chart was prepared showing the pressure range vs. the
percentage of commercialized tires, Figure 1.
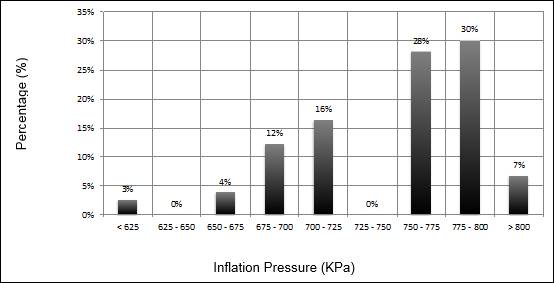
Figure 1: Pressure range vs. commercialization
Source: Adapted from Pirelli (2015).
The inflation pressure data are provided by Pirelli
according to the type of tire and some types of vehicles based on the
classification defined by DENATRAN Decree No 63/2009. This data can be
visualized in the manufacturer’s website.
3. METHODOLOGY
3.1.
Methods to calculate the “N” number and its variables
The "N"
number is calculated using the following Equation 1:
 (1)
(1)
Where,
N = number of solicitations equivalent to the standard axle; P= project period; VDM= daily average traffic volume; FV= vehicle
factor; FR = regional climate factor; D= percentage of commercial vehicles in
the busiest lane; d= percentage of vehicles in each way.
Once defined a 10-year period, according to the guidelines of the
Department of Roads of the State of São Paulo (DER/SP), the determination of
the N number consists, at first, of defining the traffic volumes of each type
of vehicle and its growth forecast.
The second stage of calculation is to define the vehicle factor (FV),
which allows the determination of the number of axles that are equivalents to
the standard axle based on the volume of vehicles with a particular
configuration of axles and loads that travel during the project period. The
vehicle factor is calculated using the Equation 2:
 (2)
(2)
Where, FE= axle factor; FC= load equivalency factor.
The maximum loads by type of axle as defined by the Scale Act and the
Brazilian Traffic Code (Law nº 9.053 of 09/23/1997 – resolution nº 12 of
02/06/1998) corresponds to 6.0 tf on the single front axle, and 10.0 tf, 17.0
tf and 25.5 tf on the single, double tandem and triple tandem rear axles,
respectively.
The equivalency factors to the standard load of 8.2 tf are analytically
determined through two calculation methods, one from USACE (United States Army
Corps of Engineers) and the other from AASHTO (American Association of State
Highway and Transportation Officials, 1972 and 1983), the former is proposed by
DER/SP and the latter for the purpose of mechanistic evaluation.
According to the sizing procedure of DER/SP, in order to consider the
variations of humidity of the materials that constitute the pavement during the
seasons of the year (resulting in variations of the capacity of material
support), one must multiply the equivalent number of solicitations of the
standard axle (or traffic parameter) "N" by a "FR"
coefficient, called Regional factor, which, on the experimental AASHTO lane,
ranged from 0.2 (low level of humidity) to 5.0 (materials are virtually
saturated).
In Brazil there are no experimental elements for that determination, but
according to DER/SP recommendations, one can adopt FR = 1.0.
3.2.
Verification of the pavement structures through the elasticity theory
The vehicles’ loads generate tensions and deformations inside the
pavement structure. These tensions and deformations are a function of the load
magnitude, the resilient modules, the thickness of the pavement layers and the
sub base’s support capacity.
Therefore, the acting shifts and deformations that originate inside the
loaded pavement were determined in order to be compared with the allowable
shifts and deformations value and that are a function of the type of material
used in the pavement structure.
In order to determine the internal efforts, the deformations and shifts
of the flexible pavement structure the computer program ELSYM 5 (Elastic
Layered System) was used, which takes into account the constant elastic
characteristics for each layer of the pavement structure. The parameters were used
to calculation:
•
Load of the standard single axle of 80 kN,
represented by 4 x 20 kN;
•
Tire/Pavement contact pressure of 5.6
kgf/cm²;
•
CBUQ Resilience Module (Coating) of 35,000
kgf/cm²;
•
Simple Graded Gravel Resilience Module of
3,000 kgf/cm²;
•
Cracked Rock Resilience Module of 2,500
kgf/cm²;
•
Resilience Module of the subbase of 700
kgf/cm2 for CBR=7%
Where CBUQ: Hot Mix Asphalt Concrete; kN: kilo Newton; CBR: California
Bearing Ratio; kgf/cm²: kilogram-force per square centimeter.
The internal shifts and deformations of the pavement structure were determined
at their critical places: at the top of the asphalt concrete layer (vertical
shift), at the lower fiber of the asphalt concrete layer (traction horizontal
deformation) and at the top of the sub base (compression vertical deformation).
In order to determine the allowable efforts the following fatigue
equations 3, 4 and 5 were used.
Vertical shift at the pavement surface - deflection – D0 (x10-2 mm)
(DNER-PRO 11, 1979):
 (3)
(3)
Traction horizontal deformation at the coating lower fiber – t
(x10-4 cm/cm). FHWA:
 (4)
(4)
Compression vertical deformation at the top of the sub base layer – V
(x10-4 cm/cm). Shell (Dormon and Metcalf)
 (5)
(5)
The values obtained by the software are used in fatigue equations shown
above for each layer of the pavement and, as indicated, the “N” number is found
for the period.
4. RESULT AND DISCUSSION
4.1.
Influence of the calculation variables on the result of the N number
N number = number of solicitations equivalent to those of a standard
road axle (ESRD) of 8.2tf (80kN) for the project period. According to
IP-DE-P00/001 – DER/SP Paving Project, in order to mechanistically verify the
pavement structure one must know the parameters regarding the support capacity
of the sub base soils and the expected traffic for the period, as well as the
properties of the materials that constitute the layers of the pavement
structure and the fatigue models for such materials. The loads to be included
in the mechanistic analysis should simulate the standard dual wheel single axle
of 80 kN, using four points of load application (20 kN each) and the
tire-pavement contact pressure of 0.56 MPa.
The mechanistic analysis of the pavement structure uses material fatigue
models that calculate their limitations through the above-mentioned parameters.
It is necessary to understand how and under which conditions the
mathematical expressions of material fatigue were obtained in order to consider
them in the evaluation of the quality and performance of a particular pavement.
4.2.
Performance of asphaltic pavements
The pavement performance evaluation was developed based on the criterion
of deform-ability of flexible pavements, expressed by measuring the recoverable
deflections since its experience has shown there is a correlation between the
magnitude of the deflections (and of the corresponding radius of curvature) and
the occurrence of failures in flexible pavements.
The behavior of a well-built pavement depends on the various
solicitations it suffers throughout its lifespan, including the traffic that
results in different efforts of compression, shearing and flection, as well as
climate factors such as rains and temperature changes that cause fatigue on the
entire structure.
Regarding the deflection, the following phases of a pavement life cycle
can be observed:
•
Consolidation phase: a phase right after
the construction and that is characterized by a slow decrease of the deflection
value due to the additional consolidation through the traffic on the various
pavement layers. The deflection values tend to estabilize at the end of this
phase.
•
Elastic phase: a phase that comes after
the consolidation phase and along which the pavement deflection value,
excluding the seasonal variations, remains approximately constant or increases
slightly. This phase defines the pavement service life, which tends to increase
according to the difference verified between the allowable deflection and the
deflection tolerated by the pavement.
•
Fatigue phase: a phase that comes after
the elastic phase and is characterized by a fast increase in the pavement
deflection value as the structure starts showing the fatigue effects
represented by fissures, cracks and accumulation of permanent deformation under
repeated loads. If no measures are taken to reinforce and recover the pavement,
usually the result is a degradation process. Figure 2 illustrates the phases of
a pavement life cycle described above.
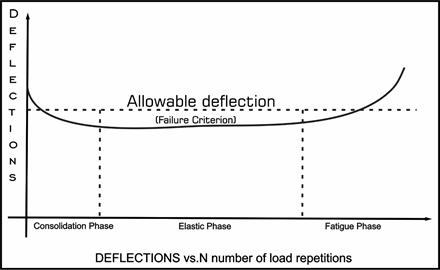
Figure 2: Phase of a pavement life cycle.
Source: DER/SP PRO 11/79 (1979).
The
flexible pavement will be technically and economically better than longer elastic
phase.
The
allowable deflection value depends on the materials that constitute the coating
and the base of the pavement, as well as on the N number of solicitations of
axels that equivalent to the standard axle of 80 kN. Figure 3 shows the
criteria for a structural evaluation, associating the allowable deflections
with the pavement state.
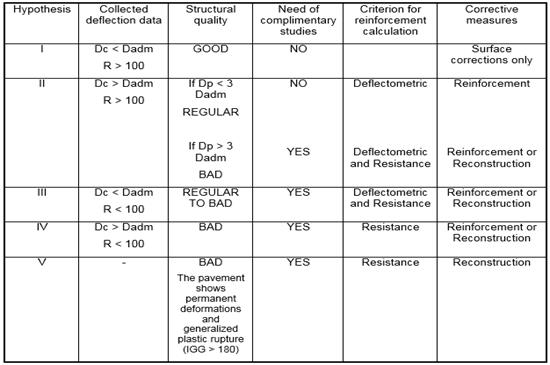
Figure 3: Criteria for a structural evaluation.
Source: DER/SP PRO 11/79 (1979).
This study used the AASHTO and USACE methodologies. The pavement
structure chosen for the study consists of a 5.0 cm thick layer of CBUQ Band
III, followed by a 5.0 cm thick layer of CBUQ Band II, a 20.0 cm thick layer of
Simple Graded Gravel as base and a 30.0 cm thick layer of Dry Bound Macadam as
sub base. Figure 4 illustrates the pavement of this study.
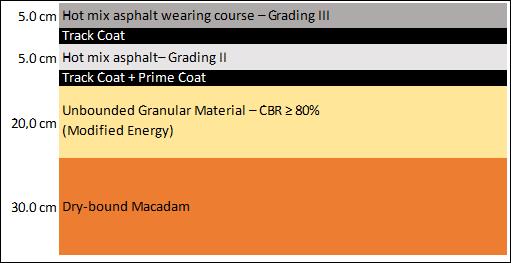
Figure 4: Structure for the study.
Source: Author (2015).
Table 3 shows the simulation of road cost per linear meter using the DER/SP
single price table of 03/31/2015, considering the structure analyzed in this
study.
Table 3: Selected structure – quantitative (Single
Price Table – DER/SP – 03/31/2015)
|
Item
|
Service
|
UN
|
EX
(m)
|
WID
(m)
|
AR
(m²)
|
COEF
|
THI
(m)
|
QTY
|
UV (R$)
|
TOTAL (R$)
|
|
23.02.02
|
Improving/Preparing
subbase - 100% Ei
|
m2
|
1
|
7
|
7
|
1.20
|
-
|
8.40
|
1.63
|
13.69
|
|
23.04.06.03
|
Dry Bound Macadam
Subbase or Base
|
m3
|
1
|
7
|
7
|
1.15
|
0.30
|
2.42
|
168.37
|
406.61
|
|
23.04.03.01
|
Simple Graded Gravel
Subbase or Base
|
m3
|
1
|
7
|
7
|
1.10
|
0.20
|
1.54
|
178.14
|
274.34
|
|
23.05.02
|
Binding Bituminous
Priming
|
m2
|
1
|
7
|
7
|
1.08
|
-
|
7.56
|
2.28
|
17.24
|
|
23.05.01
|
Sealing Bituminous
Priming
|
m2
|
1
|
7
|
7
|
1.08
|
-
|
7.56
|
4.58
|
34.62
|
|
23.08.02
|
Hot Mix Asphalt Concrete
- BinderGrad.B w/Dop
|
m3
|
1
|
7
|
7
|
1.05
|
0.05
|
0.37
|
585.43
|
215.15
|
|
23.05.02
|
Binding Bituminous Priming
|
m2
|
1
|
7
|
7
|
1.05
|
-
|
7.35
|
2.28
|
16.76
|
|
23.08.03.03
|
Rolling Layer - CBUQ
- Grad.C – w/Dop
|
m3
|
1
|
7
|
7
|
1.01
|
0.05
|
0.35
|
659.83
|
233.25
|
UN = Unity; EX = Extension; WID = Width; AR = Area;
COEF = Overwidth Coefficient; THI = Thickness; QTY = Quantity; UV = Unit Value.
Source: Author (2015)
As can be seen in Table 3 and Figures 5, 6, 7, 8, 9 and 10 shown below,
there is a significant decrease of the service life of the pavement that is the
object of this study. As the axle load applied on the contact pressure between
the tires and the road surface increases, the durability calculation projected
on the N number decreases, resulting in premature fatigue of the pavement
structure and a possible need to repair or even rebuild the road before the
10-year period required by the rule in effect.
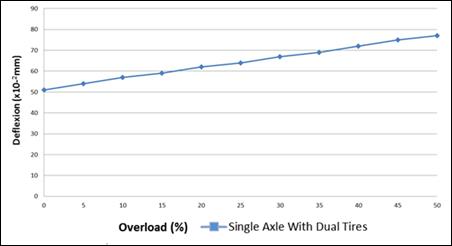
Figure 5: Deflection vs. Overload for single axle with
dual tires.
Source: Author (2015)
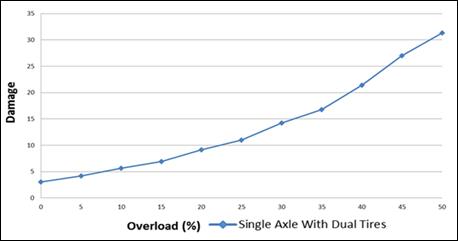
Figure 6: Damage to the service life (Deflection) vs.
Overload for single axle with dual tires.
Source: Author (2015)
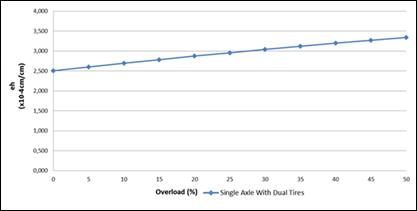
Figure 7: Tensile strain at the bottom of the asphalt
layer vs. Overload for single axle with dual tires.
Source: Author (2015)
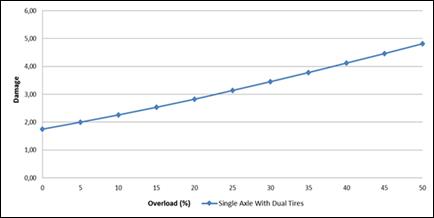
Figure 8: Damage to service life (Tensile strain at
the bottom of the asphalt layer) vs. Overload for Single Axle With Dual Tires.
Source: Author (2015)
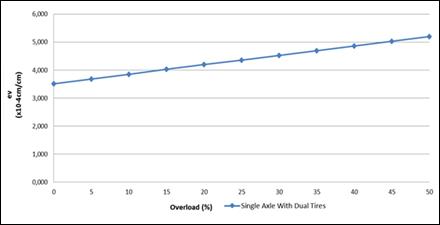
Figure 9: Vertical compressive strain on the subgrade
vs. Overload for single axle with dual tires.
Source: Author (2015)
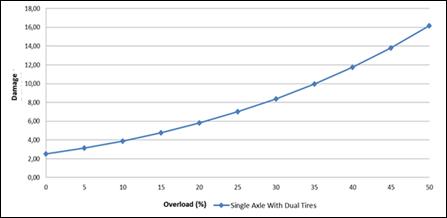
Figure 10: Damage to service life (compressive strain
on the subgrade) vs. Overload for single axle with dual tires.
Source: Author (2015)
5. CONCLUSION
The present study shows the need for a strict
control through the use of scales of commercial vehicles loads that travel on
roads. One might also suggest measuring the tire pressure so that it complies
with the standard values used in calculations of pavement design established by
relevant state and federal government entities.
6. REFERENCES
AASHTO.
(1972) Guide for design of pavement
structures. American Association of State Highway and Transportation
Officials, Washington, D.C. USA.
AASHTO.
(1993) Guide for design of pavement
structures. American Association of State Highway and Transportation
Officials, Washington, D.C, USA.
AL‐QADI, I.L.; ELSEIFI, M.A. (2007) New generation of
wide‐base tire and
its impact on trucking operations, environment, and pavements. Journal of the Transportation Research Board, v. 2008, p.
100-1009.
BALBO, J. T.
(2007) Pavimentação asfáltica:
materiais, projeto e restauração. São Paulo: Oficina de Textos.
BNDES, BANCO
NACIONAL DE DESENVOLVIMENTO ECONÔMICO E SOCIAL. 2008. Available
at:
<http://www.bndes.gov.br/SiteBNDES/bndes/bndes_pt/Areas_de_Atuacao/Infraestrutura/Logistica/index.html>.
Accessed
in August, 2015.
BARTHOLOMEU, D.
B. (2006) Quantificação dos impactos
econômicos e ambientais decorrentes do estado de conservação das rodovias
brasileiras, Tese de doutorado, Escola Superior de Agricultura Luiz de
Queiroz, Universidade de São Paulo, Piracicaba, 164p.
BERNUCCI,
L.B. et al. (2006) Pavimentação Asfáltica:
formação básica para engenheiros, Rio de Janeiro: PETROBRAS: ABEBA.
BRAZIL. (2015)
Law no 9.503/97 – Código de Trânsito Brasileiro. Available
at: http://www.planalto.gov.br/ccivil_03/LEIS/L9503.htm. Accessed in September,
2015.
CNT,
CONFEDERAÇÃO NACIONAL DOS TRANSPORTES. (2012) Available
at: <http://www.cnt.org.br/Paginas/Boletins.aspx>. Accessed on August,
2015.
CONTRAN,
CONSELHO NACIONAL DE TRÂNSITO. (2006) Resolution 210/06. Available at: http://www.denatran.gov.br/download/Consolidadas/cons210.pdf.
Accessed in September, 2015.
CONTRAN,
CONSELHO NACIONAL DE TRÂNSITO. (2006) Resolution 211/06. Available at: http://www.denatran.gov.br/download/Consolidadas/cons211.pdf.
Accessed in September, 2015.
CONTRAN,
CONSELHO NACIONAL DE TRÂNSITO. (2007) Resolution 258/07. Available at:
http://www.denatran.gov.br/download/Resolucoes/RESOLUCAO_CONTRAN_258.pdf.
Accessed in September, 2015.
CONTRAN,
CONSELHO NACIONAL DE TRÂNSITO. (2010) Resolution 365/10. Available at: http://www.denatran.gov.br/download/Resolucoes/RESOLUCAO_CONTRAN_365_10.pdf.
Accessed in September, 2015.
DENATRAN.
(2009) Decree no 63/2009. Available at: http://www.denatran.gov.br/download/Portarias/2009/PORTARIA_DENATRAN_63_09_ANEXOS.pdf.
Accessed in September, 2015.
DNER,
DEPARTAMENTO NACIONAL DE ESTRADAS E RODAGENS. (1979) Avaliação Estrutural de Pavimentos Flexíveis. DNER-PRO11/79, Rio de
Janeiro.
DNER,
DEPARTAMENTO NACIONAL DE ESTRADAS E RODAGENS. (1996) Manual de pavimentação, Rio de Janeiro.
DNER,
DEPARTAMENTO NACIONAL DE ESTRADAS DE RODAGEM (1998) Manual de reabilitação de pavimentos asfálticos. Rio
de Janeiro.
DNIT.
(2015) Law no 7.408/85. Legal weight limitations. Available at: http://www1.dnit.gov.br/Pesagem/Arq_pdf/INSTRUCOES.pdf.
Accessed in September, 2015.
DNIT,
DEPARTAMENTO NACIONAL DE INFRAESTRUTURA DE TRANSPORTES. (2006) Manual de Pavimentação, 3. ed. Rio de
Janeiro.
FENG,
W. (2005) Mechanistic-Empirical Study of
Effects of Truck Tire Pressure on Asphalt Pavement Performance, Austin,
Texas, USA: The University of Texas at Austin.
FERNANDES Jr.,
J.L. (1994) Investigação dos Efeitos das
Solicitações do Tráfego sobre o Desempenho de Pavimentos. Doctoral
Dissertation, EESC-USP.
HUANG,
Y.H. (1993) Pavement Analysis and Design.
Englewood Cliffs, New Jersey, USA: Prentice Hall.
IPEA, INSTITUTO
DE PESQUISA ECONÔMICA APLICADA [INSTITUTE FOR APPLIED ECONOMIC RESEARCH]. (2010)
Available at:
<http://www.ipea.gov.br/portal/index.php?option=com_alphacontent&view=alphacontent&Itemid=357&search=transporte+rodoviario>.
Accessed in August, 2015.
KAWA,
I.; HANG, Z.; HUDSON, W. (1997) Evaluation
of the AASHTO 18-Kip Equivalency Concept .TEXAS, USA, Department of
Transportation.
MEDINA,
J.; MOTTA, L.M.G. (2005) Resilient behavior of Brazilian tropical soils in
pavement design. International Symposium
On Pavement Evaluation And Overlay Design. Proceedings...
Rio de Janeiro: ABPv, v. 1, p. 1.1.1-22. Mecânica dos pavimentos. 2. ed. Rio de Janeiro.
PINTO, S.;
PREUSSLER, E. S. (2002) Pavimentação
Rodovíária: conceitos fundamentais sobre pavimentos flexíveis, 2ª ed., Rio
de Janeiro, Copiarte Copiadora e Artes Gráficas Ltda.
PIRELLI. (2015)
Faixa de pressão por comercialização. Available at:
<http://www.pirelli.com/tyre/br/pt/truck_bus/catalog.>. Accessed in
March, 2015.
SENÇO, W. (1997)
Manual de técnicas de pavimentação,
São Paulo: PINI.
YODER,
E.; WITCZAK, E.J.; WITCZAK, M.W. (1975) Principles
of pavement design. 2. ed. New York: John Wiley & Sons Inc.